Data Sources
The estimations reported for every day correspond to the model estimations using information available up to each corresponding day
Technical Information
General Documentation
The tools presented in this section provide a visual representation of historical periods of excessive global price volatility from 2000-present, as well as a daily volatility status. This status can alert policymakers when world markets are experiencing a period of excessive food price volatility; this information can then be used to determine appropriate country-level food security responses, such as the release of physical food stocks.
A time period of excessive price volatility
A period of time characterized by extreme price variation (volatility) is a period of time in which we observe a large number of extreme positive returns. An extreme positive return is defined to be a return that exceeds a certain preestablished threshold. This threshold is normally taken to be a high order (95 or 99%) conditional quantile, (i.e. a value of return that is exceeded with low probability: 5 or 1%). In this model, we are using the 95% quantile and look at time in 60-day increments.
Our lighting system
The probability that we will observe k days of extreme price returns (returns above the 95% quantile as explained in the definition of excessive price volatility) in a period of D consecutive days is defined as:
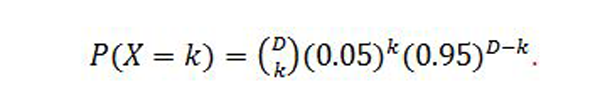
To define our lighting system, we implement a two-sided test based on a normal approximation for the binomial distribution. Using a period of 60 consecutive days that precede any date (i.e. D=60), we compare the probability value obtained from our stochastic model of returns with the chosen 5% probability of observing extreme return.
The decision rule embedded in the color system
- RED or Excessive Volatility: If the probability value is less than or equal to 2.5%, the null that violations (i.e. days of extreme price returns) are consistent with expected violations is highly questionable, meaning that we are in a period of an excessive number of days of extreme price returns relative to that expected by the model ; therefore we characterize that date as belonging to a period of excessive volatility.
- ORANGE or Moderate volatility: If the probability value is bigger than 2.5% or less than or equal to 5%, the null that violations are consistent with expectations is questionable at a low level, meaning that we are in a period of moderate number of days of extreme price returns relative to that expected; therefore we characterize that date as belonging to a period of moderate volatility.
- GREEN or Low volatility: If the probability value is bigger than 5%, we accept the null that violations are consistent with expectations, meaning that the number of extreme price returns is consistent to what is expected from the model; therefore we characterize that date as belonging to is a period of low volatility.
Days in volatility
It reflects the number of continuous days in the current level of volatility. For example, 20 days of low volatility means that since the last instance of moderate or high volatility, there have been 20 days of low volatility.
Full Press Statement
The full Press Statement is available at https://www.ifpri.org/news-release/ifpri-launches-unique-new-tool-provides-early-warning-extreme-price-variability
Estimating commodities returns
Watch Senior IFPRI Researcher and University of Colorado Professor Carlos Martins-Filho discuss the research behind these powerful tools.