How countries have coped with recent agricultural trade disruptions

Global agricultural markets have been in a constant state of uproar over the past five years. Trade wars between major trading nations such as China, the United States, and Australia, supply chain disruptions due to the COVID-19 pandemic, Russia’s war in Ukraine, crisis in the Middle East, and export restrictions in many countries have diverted supplies, altered trading patterns, and increased price volatility, which often makes markets less efficient and more costly.
Despite these disruptions, international trade in grains and oilseed products—key staple commodities essential to global food security—showed significant resilience. Importers found alternative suppliers, buyers adjusted by changing the timing of purchases, and inventory management practices went from “just-in-time” stocks to “just-in-case” levels, even though storage of food commodities can be costly. Perhaps remarkably, price spikes and periods of high price volatility for these products have been relatively short-lived.
A January 13, 2025 IFPRI policy seminar, organized with the Agricultural Market Information System (AMIS), examined the impacts of recent trade disruptions in these agrifood commodities and explored how markets can build resilience to possible future disruptions. This post highlights some of the main takeaways from the event.
Impact of the U.S.-China trade war on China’s grain and oilseed purchases
The 2018-2020 trade war between the U.S. and China had a large impact on their bilateral agricultural trade and affected trade flows from large exporters such as Brazil. In response to perceived unfair trade practices, the U.S. unilaterally implemented tariffs on a number of China exports in July 2018. China responded with counter-retaliatory tariffs affecting many U.S. exports, particularly agricultural exports such as soybeans. The trade war lasted through January 2020, when China agreed to suspend supplemental tariffs against U.S. agricultural imports as part of the so-called Phase One Agreement.
How did China fill up the domestic soybean demand? From 2015-2017, China imported an annual average of 87 million metric tons (MMT) of soybean a year, with Brazil accounting for about 50% of the total and the U.S. another 35% (Figure 1). From 2018-2020, U.S. soybean exports declined 38% from the 2015-2017 average, while Brazil’s soybean exports increased by over 45%, accounting for over 78% of China’s total soybean imports. As a result of the strong export demand, Brazil ending stocks dropped by 45% between December 2018 and December 2019.
Figure 1
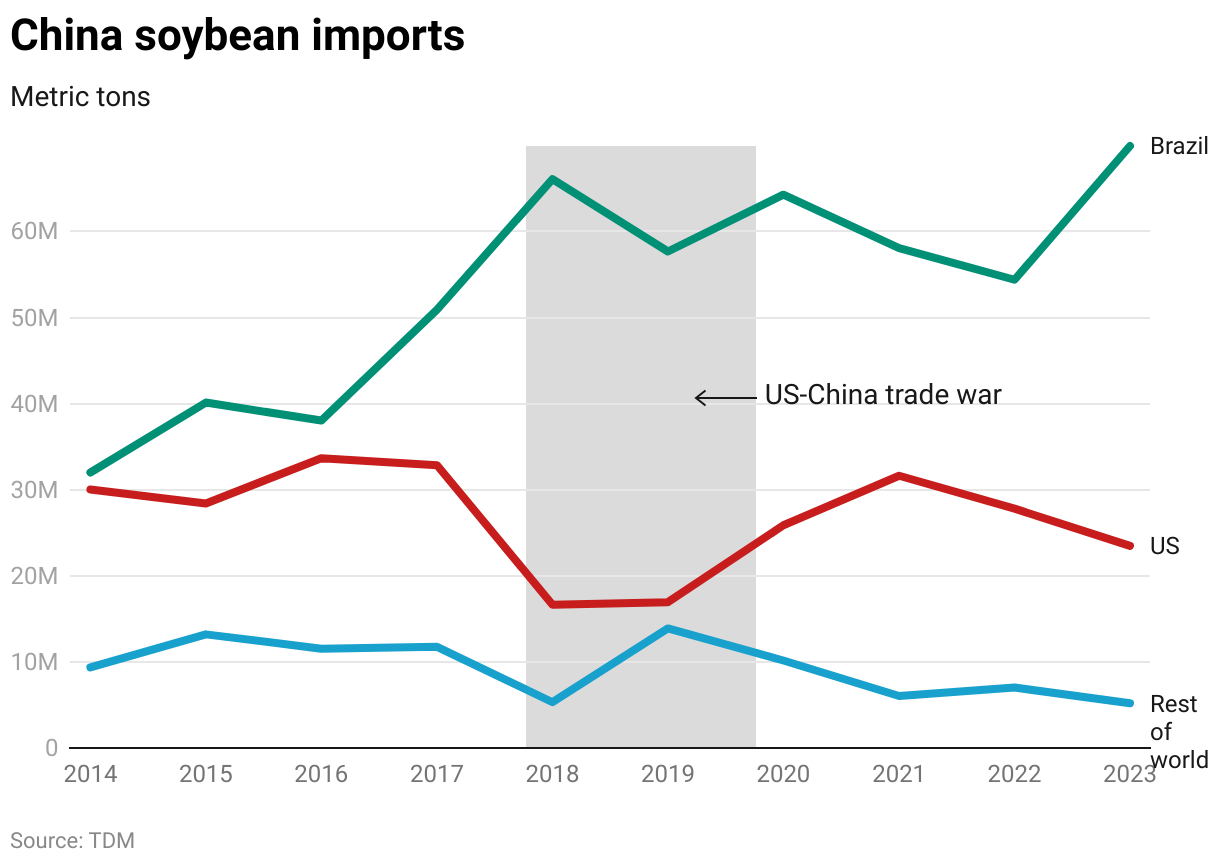
The soybean tariffs created a large premium for Brazil soybeans relative to soybeans from the U.S. A back-of-the-envelope calculation based on the spread between U.S. and Brazil soybean export prices suggests that China paid an additional $3.9 billion equivalent to buy soybeans from Brazil (and elsewhere) during the trade war. Estimates suggest that the trade war cost U.S. soybean producers about $8 billion annually in lost export revenues in 2018-2019, as exporters were forced to find alternative markets for their soybeans at significantly lower prices.
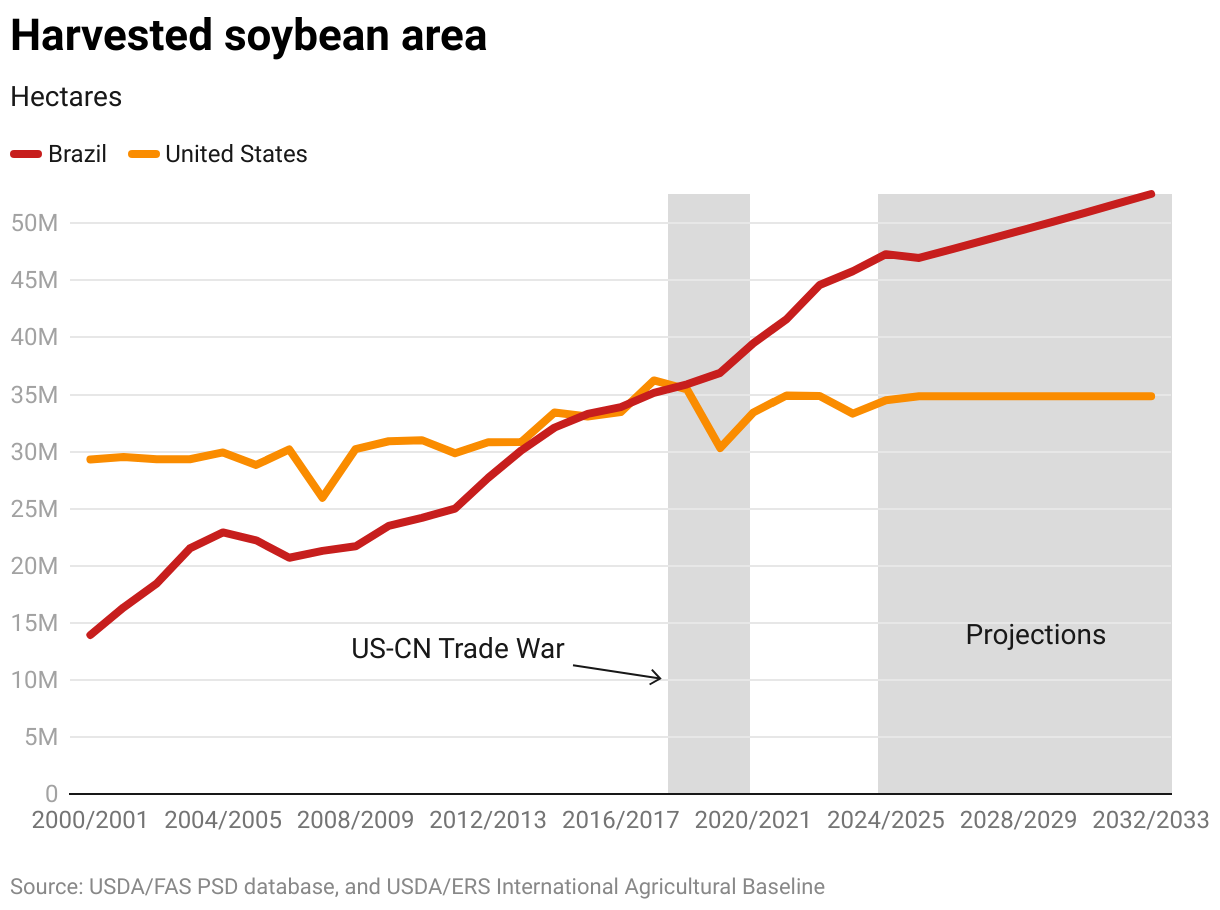
The trade war had longer-term impacts on the market as well. Incentivized by higher prices from China, Brazil expanded soybean production by increasing harvested area by 35%—from 34 million hectares in 2016-17 to 46 million hectares in 2023-24 (Figure 2). U.S.-planted area fell during the trade war and then recovered following implementation of the Phase One Agreement, but has not kept pace with Brazil’s expansion, as the availability of arable cropland is limited and most export growth met through increased yield productivity.
Figure 2
Impact of the China-Australia trade dispute on barley trade
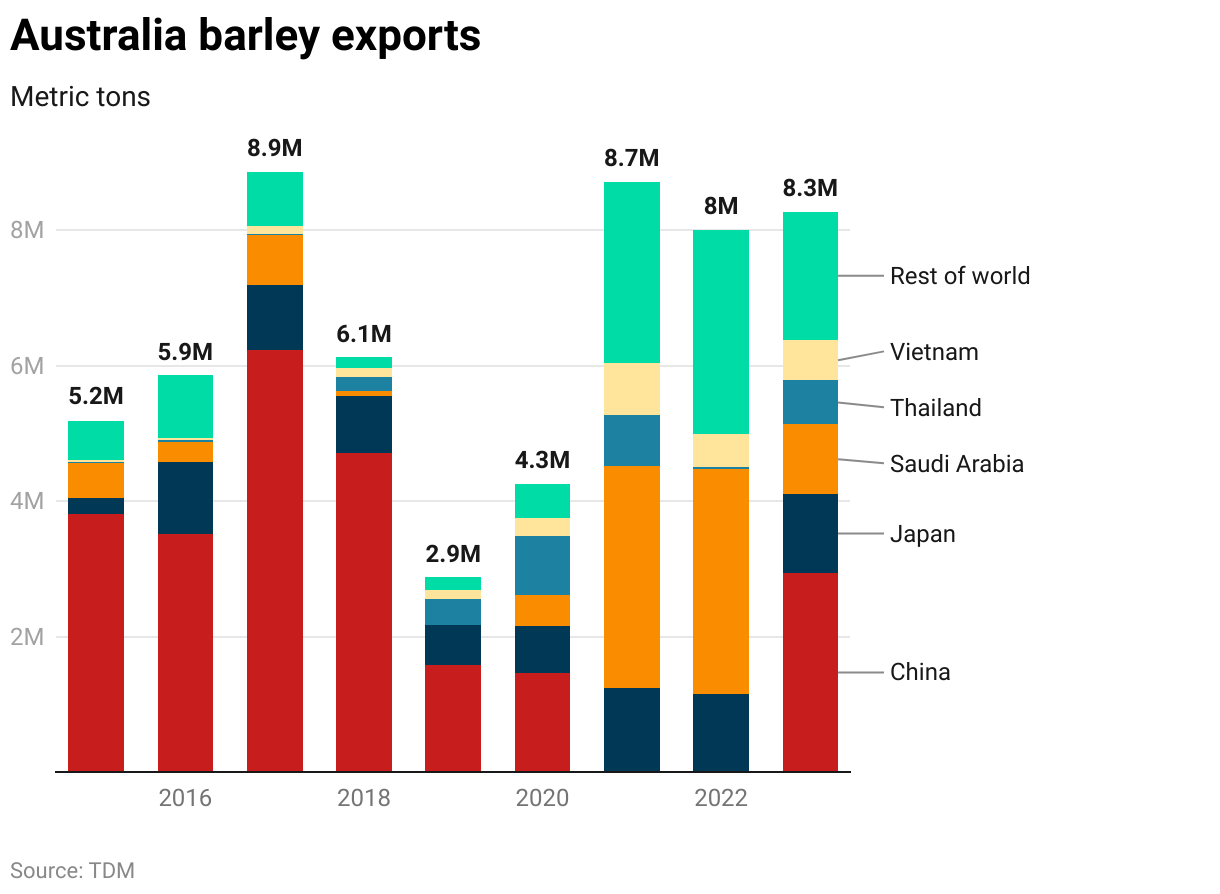
In May 2020, China imposed anti-dumping duties on Australian wine and barley; those on barley totaled over 80%, effectively halting imports worth $916 million in 2018-19. In December 2020, Australia requested consultations with China through the Dispute Settlement Mechanism of the World Trade Organization (WTO).
On April 11, 2023, the two countries agreed on a potential pathway to resolve the dispute. China agreed to conduct an expedited review of its barley duties, while Australia agreed to a maximum four-month suspension of the WTO dispute to allow this to occur. Following its review, China removed the duties on barley on August 5, 2023. Six days later, Australia and China jointly notified the WTO that the parties had resolved the matter.
Prior to the dispute, China was the biggest market for Australia barley exports, with an average annual export volume of 4.5 million MT (Figure 3). With access to the Chinese market shut off, Australia was able to divert barley exports to Saudi Arabia, which absorbed most of the export loss. Australia also increased exports to its traditional markets of Japan, Korea, Viet Nam, the Philippines, and Thailand. This trade diversion came at a cost, though, as Australian exporters received lower prices from these markets (in some cases, higher-valued malting barley had to be sold as lower-value animal feed). With the normalization of trade relations in 2023, exports to China recovered, while Australian barley exports to Saudi Arabia have been negligible.
Figure 3
Impacts of the war in Ukraine on Egypt wheat imports
Egypt has one of the highest rates of per capita wheat consumption in the world. It is also the world’s largest wheat importer, importing typically 10 million-12 million MT of wheat annually. In recent years, over 85% of this wheat has been sourced from the Black Sea region, whose exporters enjoy a competitive advantage due to the proximity to Egyptian ports.
In February 2022, Russia’s invasion of Ukraine disrupted that trade as Ukraine ports were blocked and shipping rates out of the Black Sea soared due to the conflict. There were also concerns that global sanctions against Russia might affect wheat exports. As a result, global wheat prices soared by 40%, and Egypt was forced to seek alternative suppliers (Figure 4).
Figure 4
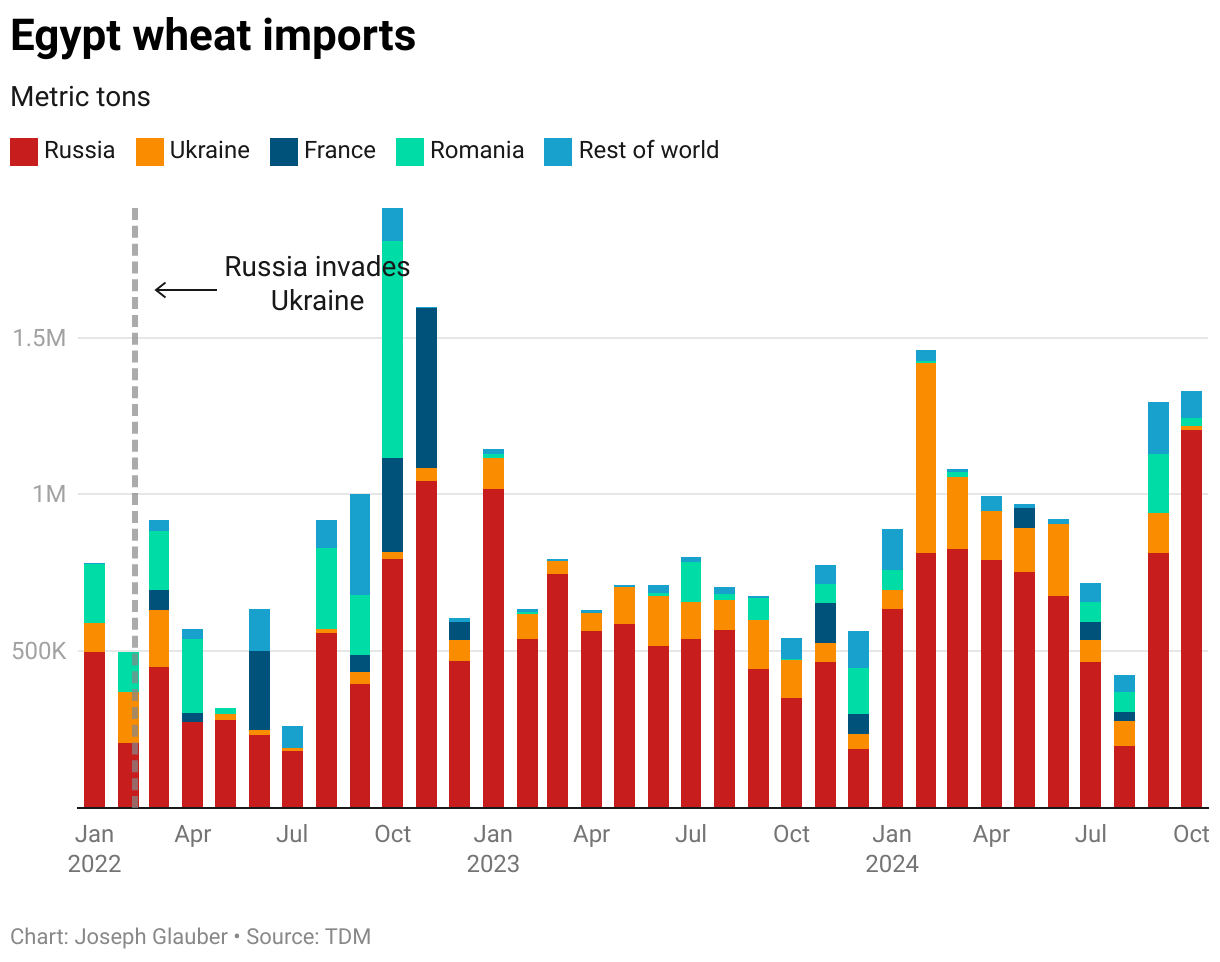
It turned to France, other Black Sea exporters including Bulgaria and Romania, and non-traditional sources such as India, which required establishing protocols to meet phytosanitary regulations. These efforts were largely successful in filling the supply gap. Within months, when trade partially resumed in fall 2022 following the reopening of selected Ukraine ports under the Black Sea Grain Initiative, Egypt was able to return to its pre-war buying patterns.
Until recently, wheat imports were primarily the responsibility of the General Authority for Supply Commodities (GASC), part of the Egyptian Ministry of Supply. In August 2024, GASC announced a record-large wheat tender of 3.8 million MT with plans to maintain a wheat reserve of 9 million MT but it was able to fill only 7% of those tenders because GASC was unwilling to accept what it considered unreasonably high bid prices. In late 2024, an Egyptian military agency took over the country's import of strategic commodities, replacing GASC, a move meant to streamline procurement operations though it is unclear whether they will continue to seek large procurement tenders.
Further complicating matters for consumers and the government, the weak Egyptian pound has kept wheat prices high in local currency despite falling prices globally. As Egyptian wheat consumption is heavily subsidized, bread subsidies have grown significantly. As a result, in June 2024, the Egyptian government raised the price of bread for the first time in 35 years.
In other efforts to help meet supply needs, Egypt has built new silos for grain storage and is trying to encourage an expansion in domestic wheat production. Initiatives such as land reclamation and incentivizing farmers with modern farming techniques are among these strategies.
Impact of India’s export restrictions on Senegal rice imports
During 2022 and 2023, India imposed numerous restrictions on rice exports, including bans on broken rice and non-basmati white rice (excluding parboiled rice), supplemental duties on parboiled rice, and minimum export prices on basmati rice. Previous posts analyzed the impacts of those actions (for example, see July 2023, October 2023, and most recently, November 2024).
Senegal consumes about 1.8 million MT of rice annually, most of it imported. As we pointed out in a July 2024 blog post, before the restrictions, India accounted for 70%-75% of Senegal’s broken rice imports. Over the 12-month period from September 2023 to August 2024, those imports fell almost 73% compared to the same period a year earlier. In response to the trade policy shock, the government of Senegal granted tax and customs waivers of around 30 billion Francs CFA (almost $50 million) to facilitate imports. Brazil, Pakistan, Thailand, and other countries helped fill the gap and as a result, total rice imports fell by only 11% (Figure 5).
Figure 5
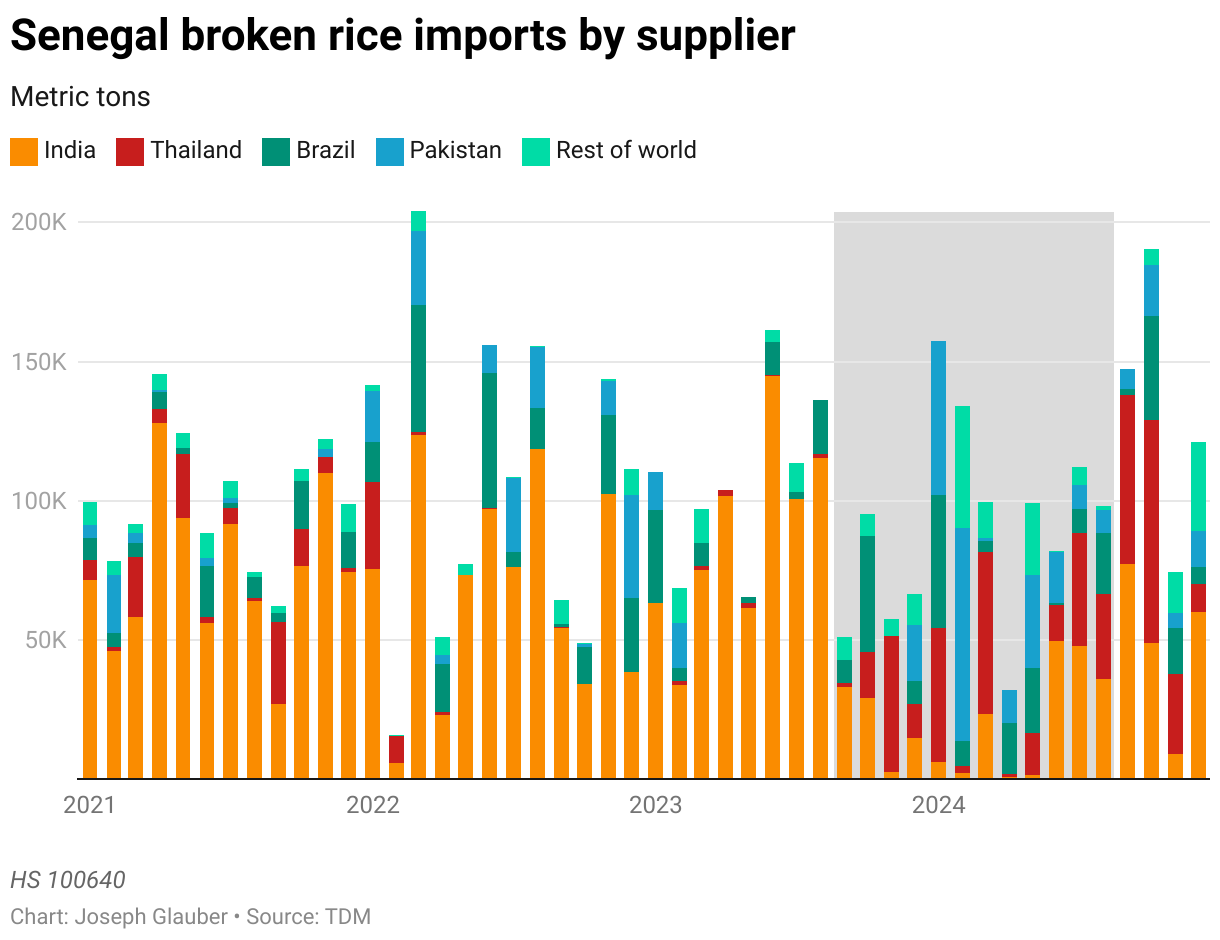
Even so, Senegal and other importers continued to face high prices caused by the restrictions. Within a few days of India’s announcement of export restrictions in July 2023, the per-kg price of broken rice in Senegal increased by 26%. In response, the Senegal government provided consumer subsidies to help offset higher rice prices.
Last fall, India relaxed most of its restrictions on rice exports but left those on broken rice in place. However, negotiations between Senegal and India resulted in a resumption of trade in the last quarter of 2024. For the months of October, November, and December, broken rice imports from India totaled almost 120,000 MT, more than 2.5 times the quantity imported from India over the same period in 2023. Prices have dropped by 10%.
Takeaways from these case studies
Several common themes emerge from these four examples of trade disruptions.
- In general, global markets functioned well in providing alternative supplies for importers facing supply disruptions (for example, China, Senegal, and Egypt). Exporters such as Australia and the U.S. found alternative markets for their exports. In some cases, (for example, Egypt, Senegal), countries have had to facilitate imports by approving phytosanitary protocols to accommodate new suppliers.
- Disruptions are also costly—both for consumers (e.g. Senegal rice consumers, China soybean crushers, Egyptian wheat millers) and sellers (e.g. U.S. soybean exporters, Australia barley growers). Some countries have compensated consumers to offset higher prices (Egypt, Senegal) or producers to offset market losses (U.S. producers of soybeans and other commodities to offset losses in the China market).
- China and Egypt both have responded to supply uncertainty by building inventories. According to U.S. Department of Agriculture estimates, between the 2018/2019 and 2023/2024 marketing years, China ending stocks more than doubled, from 18.3 million MT to 43.3 million MT. Egypt changed buying patterns to ensure supplies over the marketing year.
- Diversification strategies may be costly. At the same, self-sufficiency strategies are less feasible if the country is a high-cost producer. After the trade dispute was resolved, Australia returned to the China market. Egypt has continued to be reliant on grain imports from the Black Sea, particularly from Russia.
Lastly, the long-run costs of trade disruptions are less clear but could be substantial. It may be too early to say whether China has shifted away from the U.S.—certainly with the growth of imports it has become more dependent on Brazil as a source of soybeans, and more recently, maize.
Abdullah Mamun is a Senior Research Analyst with IFPRI's Markets, Trade, and Institutions (MTI) Unit; Joseph Glauber is a Research Fellow Emeritus with IFPRI's Director General's Office. Opinions are the authors'.